I had planned to call this page "Conclusions," which is broad enough to cover everything I want to say here (unlike the title), but that would seem to imply that there were no conclusions elsewhere in this segment, which there were. Check out the "Coefficients" page for one of the most astonishing conclusions of this entire project!
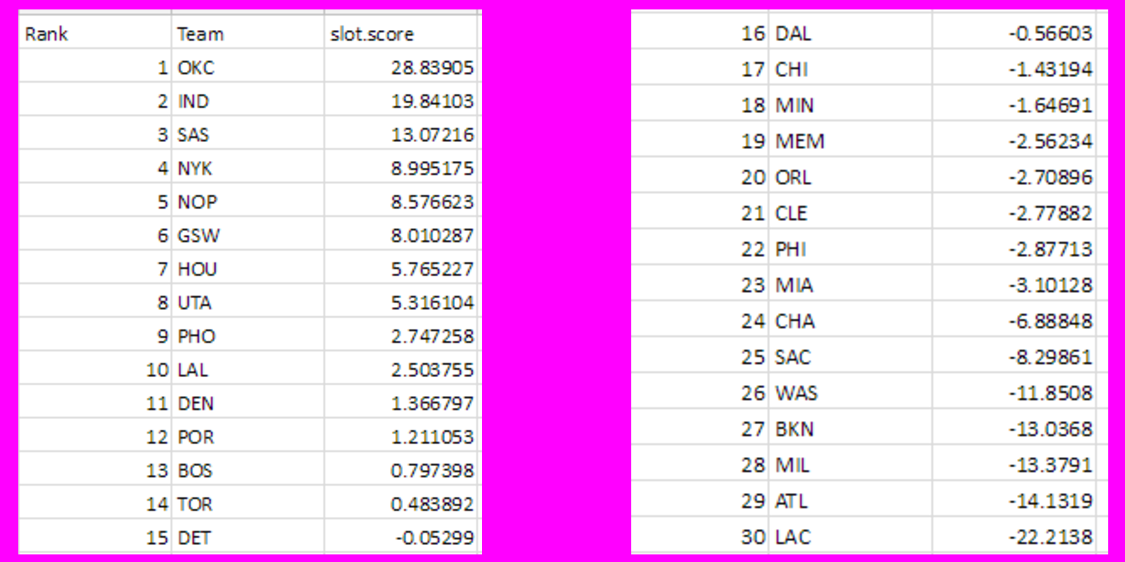
With that said, here are the final rankings of every team, derived from getting all of a team's picks' z-scores based on their slot selected, and then multiplying these z-scores by the slot's coefficient before summing them all up, positive and negative. The moment you've all been waiting for... here's what you get!
With that said, here are the final rankings of every team, derived from getting all of a team's picks' z-scores based on their slot selected, and then multiplying these z-scores by the slot's coefficient before summing them all up, positive and negative. The moment you've all been waiting for... here's what you get!
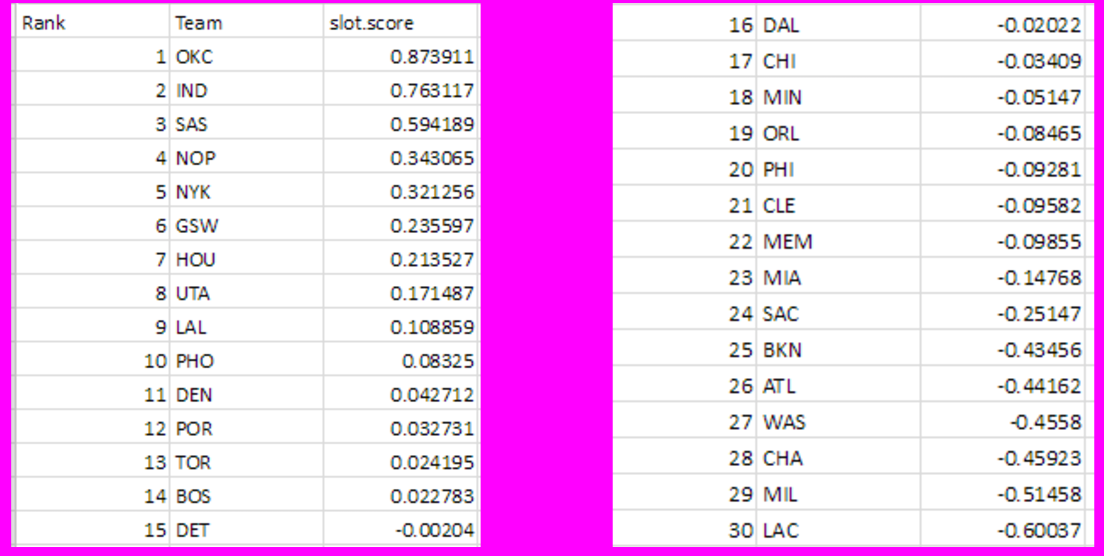
I will get back to these rankings and talk about the specific teams soon. First, let's see these rankings in a few other ways. Keep in mind that zero should always be in the middle, which makes it easy: teams with negative numbers are below-average, and teams with positive numbers are above-average.
These rankings are an average of a team's picks' z-scores. For example, the Thunder/Supersonics have 29 draft picks in our data set, thus we go 28.839 (refer to Rankings 1) / 29 = 0.8739 (Rankings 2). Thus OKC averages 0.874 "adjusted z-score" (or "slot score") per pick. This is especially useful when adjusting for teams that haven't had as many draft picks as other squads, such as expansion teams (ex: Charlotte joining in 2004) or teams like the Knicks, who traded several away (you think I'm joking). We can't include picks that weren't made in the sum -- thus these nonexistent picks simply get technically added as zero, or an absolutely average pick. Thus I consider these latter rankings as the true rankings, because they adjust for how many picks a team had. However, the drawback of these averages, of course, is that they are still susceptible to skew from just one or two really bad/good picks by a franchise like Charlotte. You'll notice that these rankings don't change too much from the sums in the previous ones; the only key observation at the top is the Pelicans jumping from sixth to fourth.
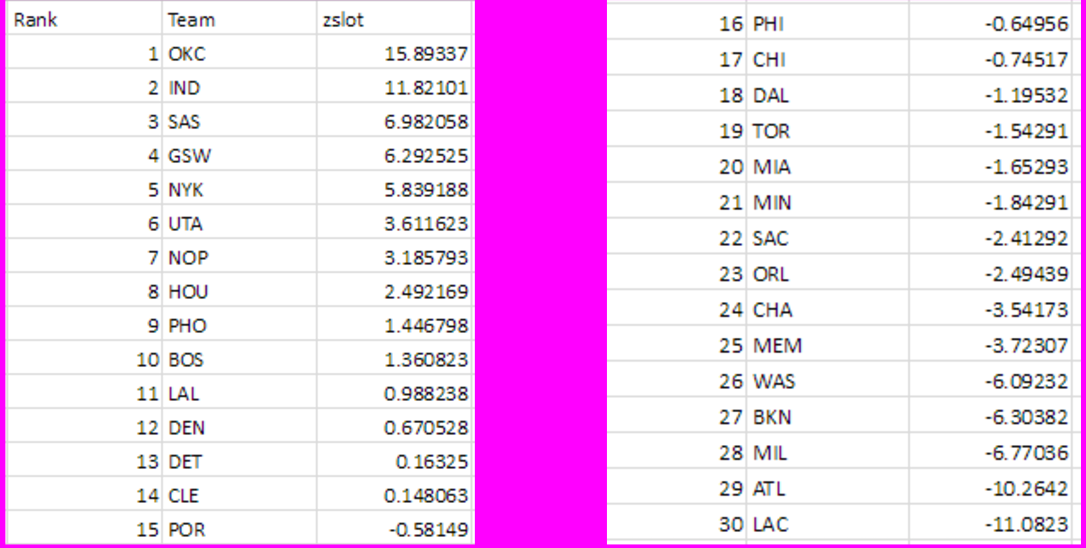
Below are the rankings without the draft slot coefficients. This is simply the raw sum of all the z-scores, no multipliers. Obviously, for the reasons discussed on the "Coefficients" page, these rankings aren't as accurate as the above rankings, but they're surprisingly (to us, at least) not too different.
Below are the rankings without the draft slot coefficients. This is simply the raw sum of all the z-scores, no multipliers. Obviously, for the reasons discussed on the "Coefficients" page, these rankings aren't as accurate as the above rankings, but they're surprisingly (to us, at least) not too different.
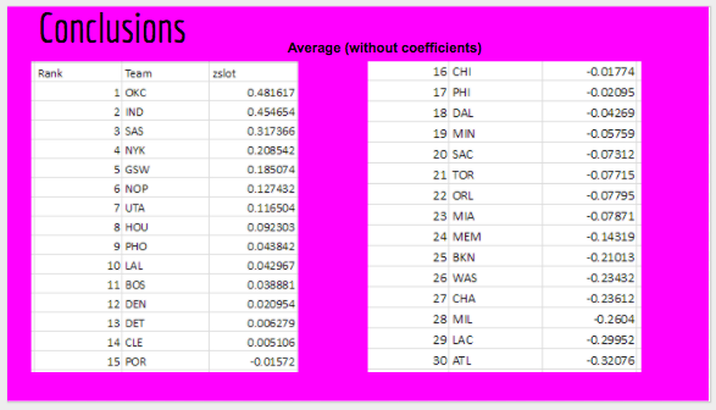
And here are the per-pick averages of those coefficient-less scores.
All right. Now it's time to discuss and analyze some interesting teams on the rankings above, above. First teams first.
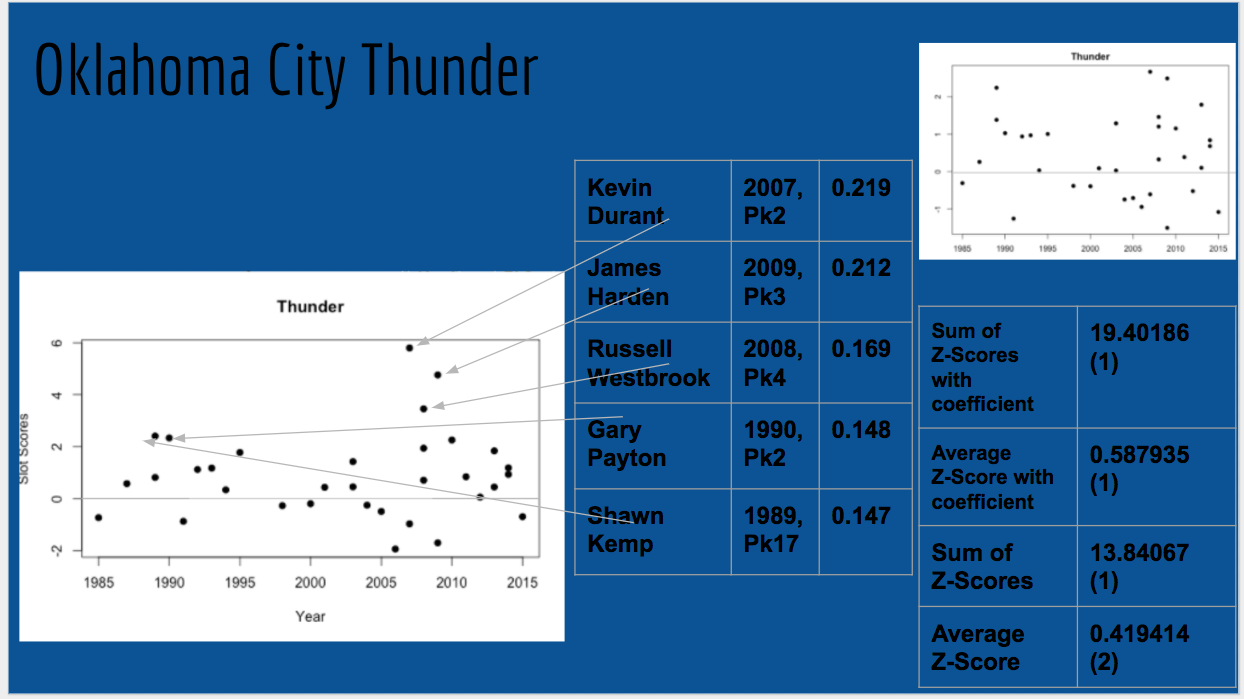
Here is everything you need to know about OKC's past drafting success, summarized in one picture.
On the chart in the bottom-right, you have their total in each of the four ranking metrics (again, "average z-score with coefficient" is probably the most accurate of them) and their ranking among all 30 franchises in parentheses. The scatterplot on the left has every one of their picks' slot scores, plotted over time. As you can see, most of them fall above the absolute average "line of zero," which makes sense for the very best drafting team. I've taken the time to point out several key picks in the Supersonics/Thunder's history; in fact, their top five best picks (which doesn't necessarily mean most WS/48! For example, Kemp has a higher slot score than Payton, even with a lower WS/48, partly because the former is a 17 pick) of all time according to our metrics have been pointed out -- the results probably shouldn't surprise you much. It's also worth noting that the Thunder boast the third and eighth best "value" draft picks (I suppose I should/can say it like that), in Durant and Harden, in our entire data set. On the left column of that player chart is their career WS/48 average. In the top-left, you see a similar plot to that of the bottom-left, but if you squint, you'll see that the Y-axis is a smaller scale; that's because it's the plot of just the players' raw z-score with no slot coefficients applied.
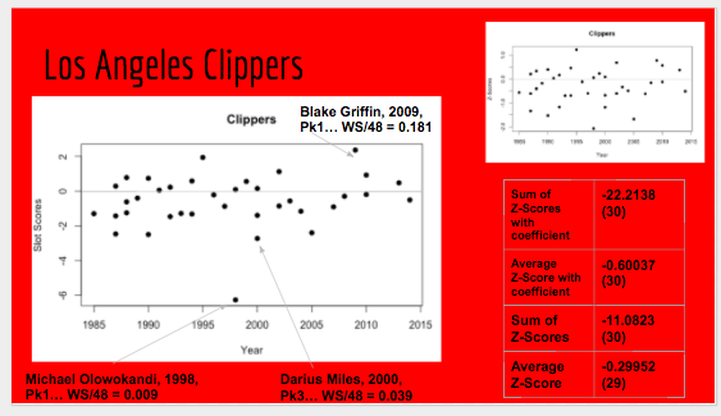
Let's contrast these excellent results -- with in fact no slot scores worse than -2 and only two picks worse than -1 -- with terrible ones. Enter, Los Angeles Clippers.
Geez. LA's scouting department sure needs a makeover.
They have only three slot scores above +1, thirteen below -1, and five below -2.4. That last figure includes "The Kandi Man" himself, who checks in as the second-worst pick in this entire data set at -6.28, "behind" only Chris Washburn (Warriors, 1986, #3), who only played one season due to run-ins with the law and health issues (both of which were primarily drug-related). It was only two years later that the Clips followed up one bad draft pick in Olowokandi with another by selecting Darius Miles third overall in 2000, when the team was already bad. Ouch.
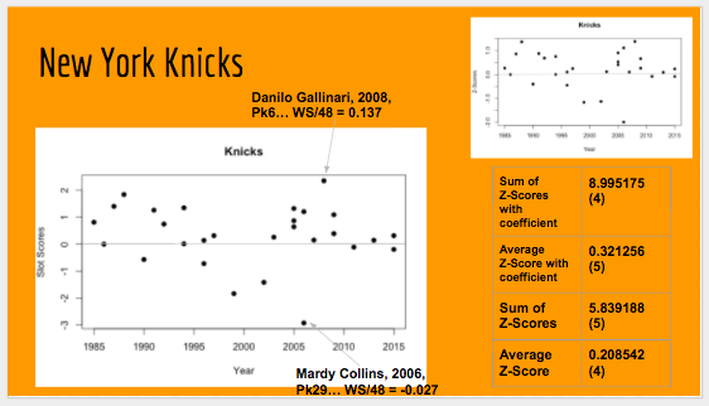
Next up I'd like to discuss probably the most surprising team on here to crack the top five: the New York Knicks.
Why surprising? Well, if you asked most basketball fans where the Knicks would check in on rankings like these, they'd probably all say somewhere lower than 20th; in fact, even yours truly predicted them to have a bottom-five finish, and my partner -- who is actually a die-hard Knicks fan -- thought about the same.
But that's the best part about projects like these: breaking "conventional wisdom!" What fun would it be if all these rankings did is confirm what we already thought we knew? To be fair, I predicted the Spurs to finish first on these rankings; he correctly picked OKC. But still, this project taught as all a lot that we didn't already know. And that's the point.
Of course, people believe that the Knicks would be bad drafters because of their terrible reputation for trading away picks (Carmelo Anthony, Eddie Curry, and Andrea Bargnani deals come to mind). But again: we cannot grade them for picks they did not make. What our project does is distinguishes between the picks that the GM's office gives the scouting department with how the scouts actually use those picks.
Anyways, go do it. Ask a basketball fan where they think New York would rank on a list of the best drafting teams of all time.
And then follow up that question by asking them to name but one bad actual Knicks draft selection.
If they can answer "Mardy Collins," then they deserve a beer on you.
If my arithmetic is correct, New York has one of the lowest number of total negative selections (eight), selections with a slot score worse than -1 (three), and selections with a slot score worse than -2 (one) among all franchises that have been in existence since 1985 (so excluding expansion teams). It may sound crazy, but if you want a consistent draft choice, ask the Knicks scouting department.
So I've shown this project to a few people, and my most frequently asked question is always something along the lines of: "Okay, this [the rankings] is cool. But what advice does this provide for general managers in the NBA?"
So let me answer that with a couple more team examples that are pretty stark contrasts of one another.
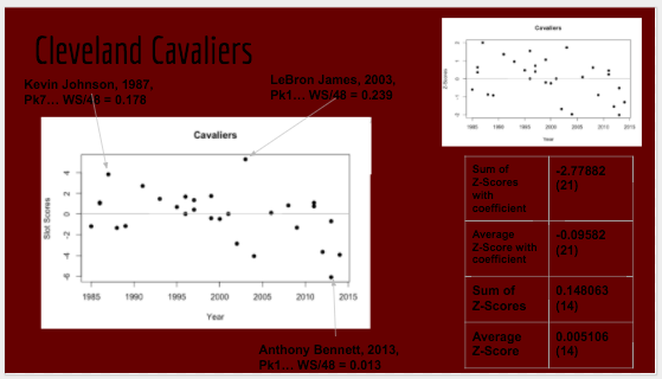
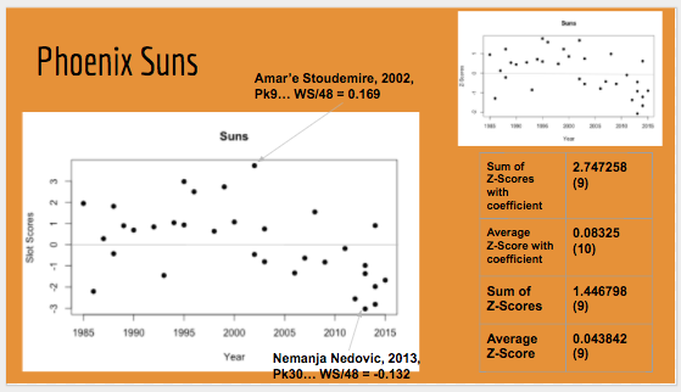
Here we have data and analysis for the Cavs and the Suns. Over the course of the past thirty years, both teams are about middle-of-the-pack in terms of drafting skills (the Cavs are slightly subpar, I suppose). But how about recently?
Both teams are undoubtedly trending in the wrong direction: the Cavs have yet to make a legitimately strong pick since LeBron, and the string of poor selections recently culminated in Anthony Bennett, the third worst pick in this entire data set.
So what would I tell new Cleveland GM Koby Altman? It's time to shake up ex-GM David Griffin's scouting department/methods, because it's clearly not working out. Same goes for Phoenix, really: you'd think there was some sort of strong negative correlation between the two axes if you looked from their 1995 picks onwards. Start doing things differently; namely, better. How? I don't know... you think I just got all the answers here or what?
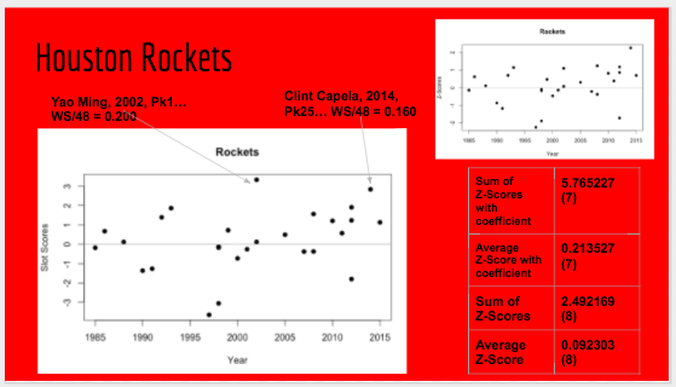
On the flip side, buy every Rockets scout a beer (and charge it to the Clippers).
And General Manager Daryl Morey a whole damn barrel. Likely uncoincidentally, Morey -- whom some dub the "Billy Beane of basketball" -- took over as general manager in Houston in 2007; shortly after, this progressively upward trend of good picks occurs, even late in the draft, where (as the "Coefficients" page discusses and proves, it is even harder to select a consistent player).
So that essentially brings me back to where I started this entire segment: a discussion about whether, and if so to what extent, the "Mo(n/r)eyball Method" has made its way -- and more importantly, its success -- into basketball.
At the end of the day, the truth is that all the questions there are too complex/vague, or have far too murky answers, to summarize in merely a sentence or two. But what we do know is that teams have been pretty good about drafting in the first half of the first round, while terribly clueless about how to rank players in the second half. We can also hypothesize that Morey's methods made Houston better drafters, and that the Thunder and the Spurs -- whom ESPN classifies as "All-In" and "Believers" in the analytics movement sweeping the NBA today, respectively -- have those methods to thank for their top three rankings on this list. Conversely, the Nets (25th), Wizards (27th), and Clippers (30th) -- classified as "Skeptics" or "Nonbelievers" in LA's case -- might be sitting at the back for their steadfast refusal to use numbers, instead of conventional subjective methods, in order to evaluate players. We can hypothesize all of that, but the fact is that we don't know. But that's all right.
Because what fun would it be if we did?
P.S. Below please find the above "diagrams" for every team, listed alphabetically by city. Feel free to contact me to let me know what you think about this segment!
And here are the "best" fifteen draft picks, from 1985 to 2015. And, of course, the worst.
Here are the links to each of the pages on this segment. I hope you enjoyed reading it as much as I did writing it!
- Introduction
- Outline
- Coefficients
- Grooming the Data Set
- Final Rankings
READ MORE: For comparable/complimentary analyses to ours, I have compiled the following links from around the web, for your interest.
ftw.usatoday.com/2017/06/nba-draft-performance-grades-best-drafting-teams-picks-2007-2016
fivethirtyeight.com/features/how-much-is-winning-the-nba-draft-lottery-really-worth/
http://www.businessinsider.com/1-pick-nba-draft-value-chart-2012-6
http://www.predictionmachine.com/NBA-Draft-Picks-Value-Win-Shares-June-2016

 RSS Feed