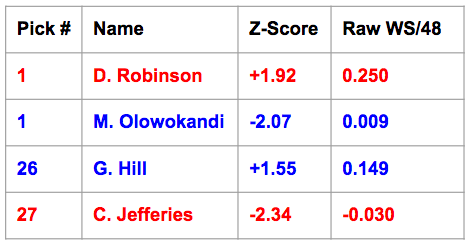
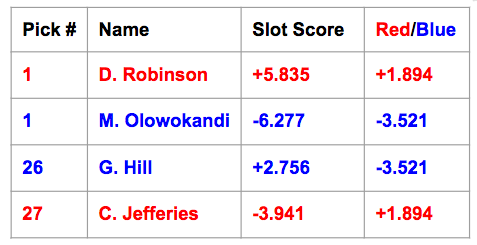
The "serious flaw" can best be explained in the following "Red Team/Blue Team" example. Imagine a "red" franchise and a "blue" franchise if you will, each granted a number one pick and a late first-rounder. They draft as follows:
So both teams' z-score sums are about in the -0.4 to -0.5 range (ish); thus according to our model, both teams are slightly sub-par drafters (zero being the average) and are roughly equal to each other.
Except that's BS. Clearly. The Red Team has nearly two-thirds of a tenth of a WS/48 higher than the Blue Team (okay, well, that's actually a lot for WS/48! All right?). Olowokandi and Jefferies are both non-factors, and with all due respect to George Hill -- a decent starting point guard in the league today -- he's nowhere close to being close to being one of the greatest players of all time like "The Admiral" is. We need to figure out a way to weight higher draft picks more, because they're clearly more important and get more win shares. So how to do it?
The first instinct -- tempting -- was to just assign multipliers, or coefficients, to each draft pick that we thought was fair. For example, #1 picks can be multiplied by 4.0 before being added towards their team's sum, #2 by a coefficient of 3.9, #3 by 3.8, and etc until #30 is 1.0.
But that's too arbitrary, and could easily be very far off from what is correct. For example, 4 / 3.9 = 1.026, meaning that #1 picks are hardly more important, or better, than #2 picks. Whether that's true or not, the fact is that we don't know. And at the end of the day, it's always (sometimes) more accurate for numbers to make decisions than for people to do so.
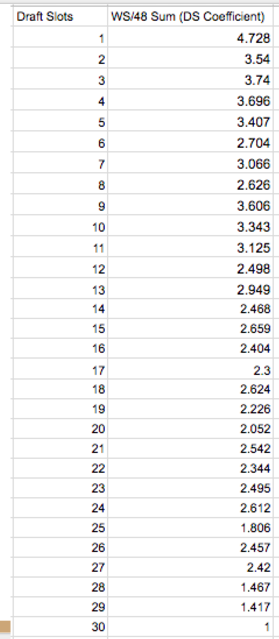
So how to let the numbers tell us how to weight the draft slots? I came up with an idea that ended up being on the right track, but it was a mistake, and worse: one that took us a very long time before we even realized it was exactly that. We took the sums of the Win Shares per 48 Minutes of every slot -- 1, 2, 3 through 30 -- and compared them. The first slot, unsurprisingly, summed to the highest at 4.5 ish and the 30th slot the lowest at 0.8-something. Then we established "draft slot coefficients" by dividing the sums of slots 1 through 29 by this 0.8-something number, and setting slot 30 equal to 1. For instance, the number one slot's coefficient now come out to 4.7-something.
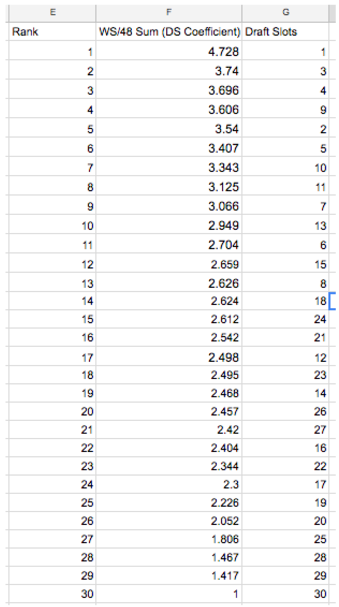
Beautiful, right? On the left are just the coefficients for each slot, while on the right you see them ranked with a pretty clear trend -- that is, higher draft picks tend to do better -- with a few interesting deviations, perhaps most notably #9 (Dirk Nowitzki, Tracy McGrady, etc) over #2. Since overall, this all didn't not make sense, we didn't think twice about it.
That might not seem like such an obvious thing to do, but questioning these rankings becomes more obvious when you take into account just how much we knew by this stage. We had literally said before, ironically to justify another one of our erroneous conclusions, that "[the existence of] expansion teams means that there hasn't always been thirty picks in every draft." But it actually wasn't until after we had presented our project initially that my partner put two-and-two together: if there have been fewer 30-picks (picks from the 30th slot) than say 25-picks, then how the hell are "sums" fair? Of course slot 25 will have more WS/48 than 30 if it has twice the number of players' WS/48 to add up! (To be honest, if it weren't for his bringing it up, I'm not sure I ever would have realized our mistake of inappropriately taking sums)
This was a brutal error, and one that could have easily been corrected, plain and simple. So how could we have done it right? Be like any good detective: go over what you know at every stage. It might sound, obvious, tedious, unnecessary, or all three, but prudence is speed on these kinds of projects. Why a detective? Because you are indeed detecting -- detecting what is wrong. And there is indeed something wrong, you can almost be sure of it: with complex projects like this one, they are very rarely done right the first (nor fifth) time. If nothing is wrong, you didn't look hard enough. If I had to limit myself to only one metaphor to sum up all of our mistakes throughout this project, it was that we forgot why the tortoise beat the hare.
Of course, if the length of each data frame isn't the same, we can easily take means instead of sums. This actually brought with it some pretty surprising results.
For one, before we brought in the soon-to-be-mentioned "ghosts," slot 30 only had eight data points (Bobcats/Hornets joined in 2004, and three of the eleven up to 2015 were ghosts), allowing its mean to easily be skewed one way or the other by just one or two stray data points.
(apologies for the ordering: "ghosts" shall be explained soon on the following page in this segment. They are players who were not in our data set initially.)
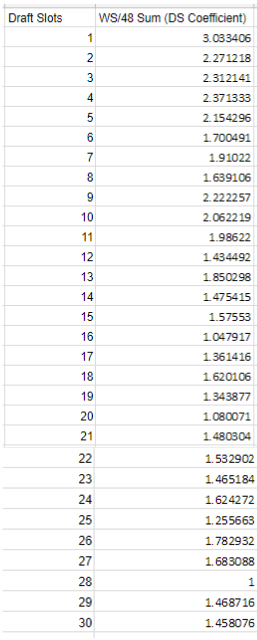
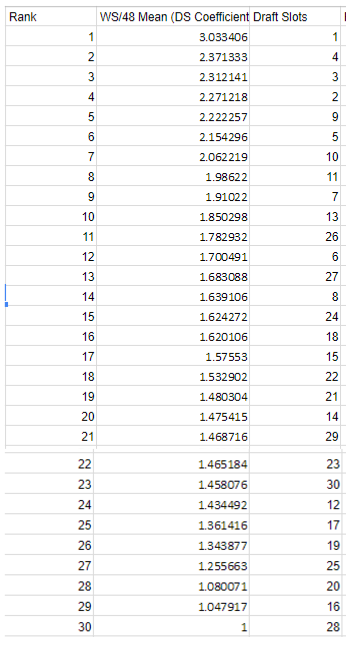
And it was: Jimmy Butler and David Lee actually catapulted slot 30 from being ranked 30th by sums to now being ranked third by means. That seems a little extreme, and was in fact one of the largest impetuses for our decision to "bust the ghosts." The addition of the three ghosts brought slot 30's mean down from 3rd to 22nd, which is not only more reasonable, but now (finally) correct (we think). Slot 28 ended up with the lowest mean, thus having a coefficient of one. Here are the new coefficient rankings, ghosts and all:
We should clarify any potential misconceptions about what these coefficient rankings mean prior to applying them, especially given the surprising ranking of the 26th draft slot above the 6th. It does not mean that we predict Caleb Swanigan (the 26th pick this past June) to be better than Jonathan Isaacc (sixth) at all -- we would not presume these rankings to have any predictive power (future). However, what they do do is evaluate the past: "from 1985 to 2015, according to career WS/48 averages of all players taken in each respective slots, the 26th picks have performed better than the 6th picks." That's what it means; we should be very clear and careful about this. The importance to us is that since the 26th slot accumulates more win shares, we must weight the selections there higher than that of the sixth slot.
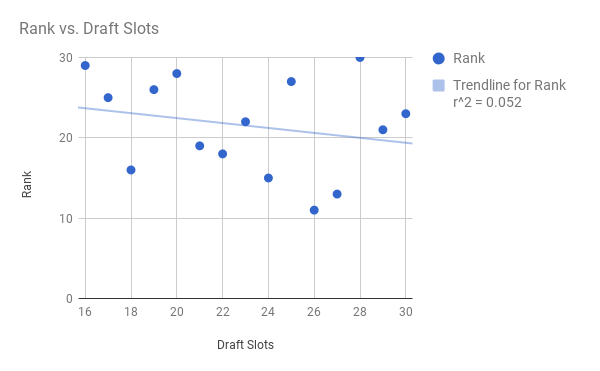
So, if you were among those whose curiosity I piqued at the beginning of this segment when I raised the question of how good NBA teams have been at drafting, we might be starting to answer your question. If all the teams were always perfect (assuming our career WS/48 as a measuring stick is equally perfect, which I suppose it isn't quite), then draft slot 1 would be higher than draft slot 2 on these rankings, would be higher than 3, etc -- all the way down to 30. The correlation coefficient, r, would be equal to precisely one in this world free of flaws, if draft slot were to be plotted against that slot's "rank" under our system. But clearly as you can see by consulting the draft slot rankings on the right, that isn't the case -- as noted above, 26 is higher than 6! 16 is second-to-last! R is thus by no means equal to 1 (for those of you unfamiliar with r, the correlation coefficient, a quick Google search would explain it better than I can here; measures strength of relationship between X and Y axes). So?
So, if you were among those whose curiosity I piqued at the beginning of this segment when I raised the question of how good NBA teams have been at drafting, we might be starting to answer your question. If all the teams were always perfect (assuming our career WS/48 as a measuring stick is equally perfect, which I suppose it isn't quite), then draft slot 1 would be higher than draft slot 2 on these rankings, would be higher than 3, etc -- all the way down to 30. The correlation coefficient, r, would be equal to precisely one in this world free of flaws, if draft slot were to be plotted against that slot's "rank" under our system. But clearly as you can see by consulting the draft slot rankings on the right, that isn't the case -- as noted above, 26 is higher than 6! 16 is second-to-last! R is thus by no means equal to 1 (for those of you unfamiliar with r, the correlation coefficient, a quick Google search would explain it better than I can here; measures strength of relationship between X and Y axes). So?
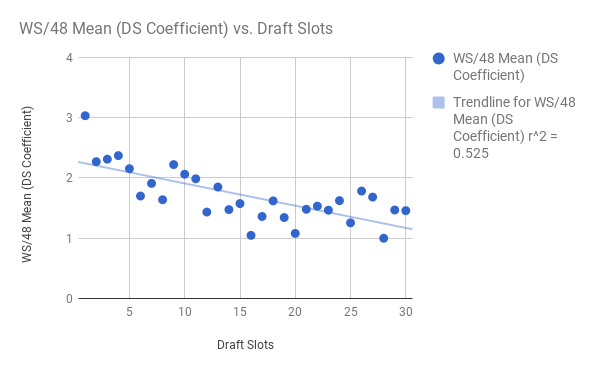
On the left, we have the independent variable, draft slot, plotted on the x-axis against that slot's WS/48 mean. The data looks fairly neat, with most of the points hugging the best fit line, which appears to exhibit a gradual downward trend in a slot's WS/48 mean as you get later in the draft. Makes sense, no? (For the record, sq-root[0.525] = r ~ 0.725).
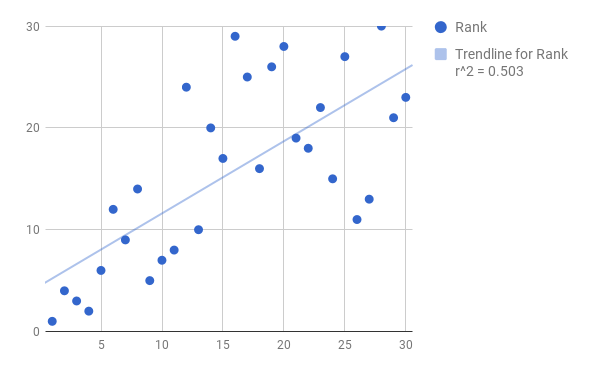
On the right, we again have the independent variable draft slot, but now the variation in the points is magnified. R hardly drops from the left graph (now at 0.71). The "best fit line" predicts the points decently well, but not amazingly; in fact, we can see that once you get past the lottery or so, it's impossible to predict! Let's take a closer look:
On the right, we again have the independent variable draft slot, but now the variation in the points is magnified. R hardly drops from the left graph (now at 0.71). The "best fit line" predicts the points decently well, but not amazingly; in fact, we can see that once you get past the lottery or so, it's impossible to predict! Let's take a closer look:
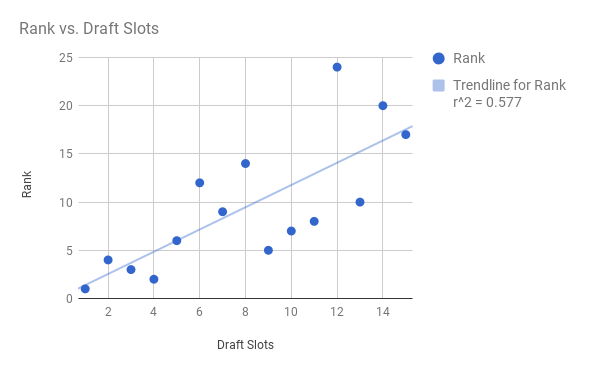
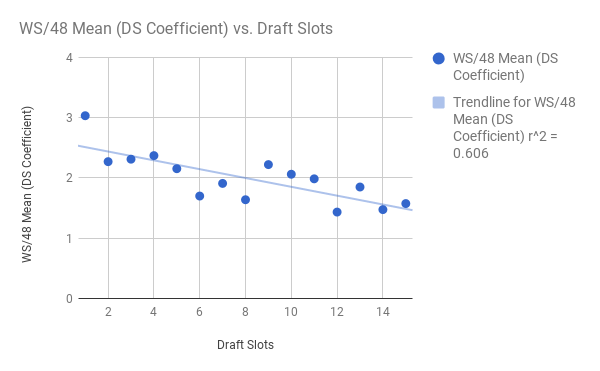
Wow! On the left, broken down by only slots 1-15, you see a very strong correlation, with r now jumping to 0.76 (0.7855 if you dismiss the anomalous 12th slot, ranked a measly 24th). What does this mean? Well, in general, teams do a very good job of taking the best players in the first half of the draft. How about in the second half? (picks/slots 16-30)
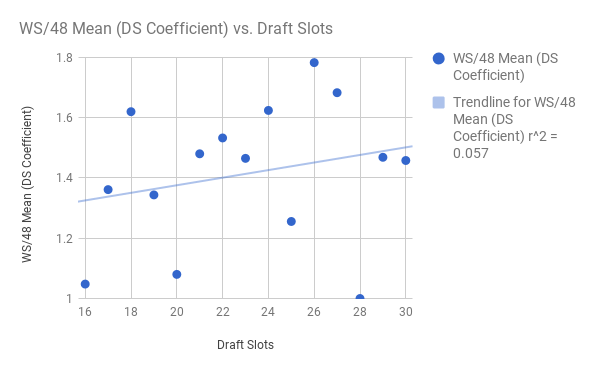
Terrible. Absolutely horrendous. The "best fit line" is actually negative! This means that later picks -- among slots 16 through 30 -- tend to do better than earlier picks!
Now, we would never suggest that a team should trade down from 16 to 30 just for the heck of it. This model is based on past data. Still, it could impart a lesson onto GM's across the league: late-round picks are a goddamn crapshoot. It hardly matters where you are once you hit the second half of the first round.You want a safe bet? Trade into the lottery. I may have to re-evaluate my assessment of Portland trading numbers 15 and 20 to Sacramento for number 10 this year.
Here is the chopped up data when we switch "rank" to the slot coefficient on the y-axis:
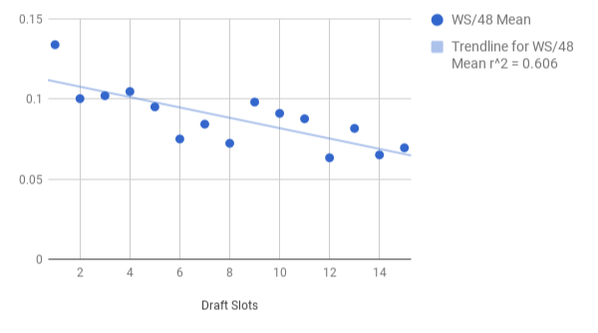
The square root of 0.606 (r^2) = r ~ 0.78 for anyone who is curious about the graph on the left. Again, the same sort of trend: among picks 16-30, a slot's mean WS/48 actually goes up as you go later in the draft -- no trend. But among picks 1-15, a slot's WS/48 mean goes down in fairly predictable fashion as you get later in the draft. In fact, let's make it predict. First, we should just adjust the scale by re-dividing the data by slot 28's mean (which was the lowest) of 0.04-something. Now, we have the slot's true WS/48 mean along the y-axis.
Y = -0.003233*X + 0.1141
Where Y = a player's predicted career average of their WS/48
X = the player's draft slot
But like any good statistician, you must always give a confidence interval!
With 95% confidence:
Slope: -0.004796 to -0.001670
Y-intercept: 0.09993 to 0.1284
So how is this useful? Let's take another look at Jonathan Isaac, on whom the Orlando Magic used the sixth overall pick in the draft this year. The linear regression line tells us:
Y = -0.003233*(6) + 0.1141
Y = 0.094702
But we must give both his lower and upper-bound estimates of the confidence interval. The lowest and the highest numbers that we can get, given the bounds of the slope and Y-intercept as stated above, are:
[0.071154, 0.11838]
Meaning that I am 95% confident that Isaac's career WS/48 average (or any sixth pick, for that matter) will be in that range.
And now (it's about time, isn't it?), finally, you can see the coefficients applied. At 26 and 27, George Hill and Chris Jefferies' slot coefficients aren't quite leaps and bounds greater than one, meaning that there isn't that much of a difference between their z-score and final slot score. However, being number one picks, the David Robinson and Michael Olowokandi selection are now magnified more than three-fold. Observe what happens when we now add "slot scores" instead of just raw "z-scores."
The red team's final score is now nearly 5.5 "slot score sum points" (don't worry, we don't actually call them that) above the blue team, in addition to now clearly being an above-average team (their sum is definitively positive). So every draft pick will now have their slot's coefficient applied before contributing to their (real) team's sum. Now, with the relative importance of each draft pick correctly weighted, we can proceed towards the conclusions. But first we must make sure our data set itself is okay.

 RSS Feed