I add this post outside of the main flow of this segment; its purpose is to ensure that all readers who wish so can understand what z-scores are, for they are the foundation of this project, which would not be well-understood by one who hasn't mastered z-scores. So let's do just that. If z-scores already make sense to you or if you had already known them, then you may carry on to "Coefficients."
The first and most important thing to understand -- not only for this purpose but for the entire purpose of statistics -- is what we call the normal model.
The first and most important thing to understand -- not only for this purpose but for the entire purpose of statistics -- is what we call the normal model.
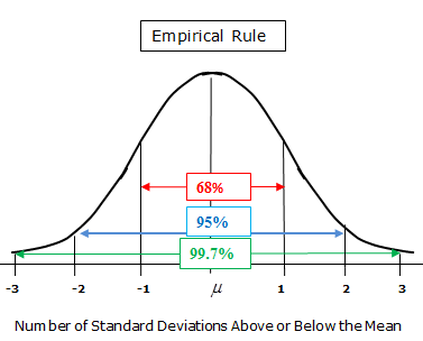
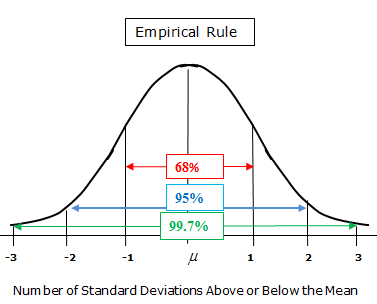
Refer to the above diagram throughout this discussion.
Let's say LeBron James, for his career, has a mean of 27 points per game and a standard deviation of 5 points per game (the latter statistic entirely made up), and that the data is normally distributed. What does this mean?
The "Empirical Rule" tells us that slightly over 68% of the data falls "within one standard deviation of the mean." If the mean is 27, and the standard deviation 5, then that would be between 22 and 32; in English: for his career, in 68% of games, LeBron scored between 22 and 32 points.
The rule also tells us that slightly over 95% of the data falls "within two standard deviations of the mean." I bet you could tell me the range now: two times five is ten, so plus/minus ten on either side of 27. LeBron scores between 17 and 37 points in a little over 95% of games. This actually makes sense.
Now, 99.7% of the data falls within three standard deviations of the mean: a range between 12 and 42 now. If only 0.3% falls outside of those bounds, then we could say that a 42-point-performance by LeBron would "be in his 0.15th percentile of games," for the other 0.15 percent is on the lower side of the bounds. If he scored 12 points in a game, we'd say that only 1.5 times out of 1000 does that occur.
As you can see, three standard deviations from the mean, in either direction, is very, very far. Sometimes, we consider anything that far to be "outliers" or extremes. Most of the data falls within one or two standard deviations.
The shape of the normal model in fact measures the frequency. The higher the black line is vertically, the more frequent it is. You'll notice that right around the mean is the most frequent occurrence, and points gradually get rarer as you get further from the mean. In this example, the closer a given LeBron James scoring total is to 27, the more frequent/likely it occurs.
So what are z-scores then?
Formally, they measure "how many standard deviations you are above the mean." If you understood what you've read thus far, you'll understand z-scores no problem.
Remember: the mean is 27 and the standard deviation is 5. So how many "standard deviations above the mean" is LeBron's performance if he scored 32 in a night?
One. Thus the "z-score" is one. We know from the empirical rule that that game falls in his 68th percentile. The formula:
(z-score)(standard deviation) + (mean) = (observation)
or
(z-score) = [(observation) - (mean)] / (standard deviation)
Let's try this again, but this time I'll ask what LeBron's z-score is if he dropped 34.5 (impossible, I know, but just go with it). Plugging the numbers in, we get:
(z-score) = [(observation) - (mean)] / (standard deviation)
(z-score) = [(34.5) - (27)] / (5)
(z-score) = (7.5) / (5)
(z-score) = 1.5
How about if he scored 23?
(z-score) = [(observation) - (mean)] / (standard deviation)
(z-score) = [(23) - (27)] / (5)
(z-score) = (-4) / (5)
(z-score) = -0.8
Yes, z-scores are negative exactly as often as they are positive! Such is the case when we set the mean to have a z-score of zero. Indeed, 23 is "negative 0.8 standard deviations above the mean (of 27)."
So why do we care about normal models and z-scores and all of this?
Well because they can easily be turned into probabilities. Find any old z-score-to-probability calculator online, and they'll tell you exactly how common (thus, "what the probability is") it will be that LeBron scores 23. Or 35. Or 50. That's why we care.
Now, of course, I just made that "standard deviation = 5" up for LeBron's scoring. It makes decent sense as a basketball junkie that LeBron might score between 17 and 37, 95% of the time, but of course that's very inexact. Numbers in statistics are never aesthetically pleasing: LeBron's true points per game standard deviation probably has a decimal that may well never end.
But anyways, that's a very basic introduction to the normal model, means and standard deviations, z-scores, and actually statistics as a whole. Just remember: most of the data falls within one or two standard deviations of the mean, and a z-score with an absolute value of three only comes 1.5 times per 1,000 -- a quite rare observation. Anything beyond that is absolutely astonishing (depending, potentially an outlier). Now, onto the coefficients!


 RSS Feed